AI Overviews now appear in nearly 25% of searches, while zero-click behavior and declining organic CTRs are reshaping traditional SEO. At the same time, platforms like ChatGPT are driving billions of prompts daily and sending growing referral traffic to websites.
AI Overviews now appear in roughly one out of every four Google searches, accelerating a trend marketers have been watching for years: fewer clicks, more zero-click searches, and shrinking control over how audiences.
Key AI SEO Statistics
AI is increasingly shaping how users find information and reducing reliance on traditional organic search clicks.
1. AI Overviews now appear in 25% of global searches.
2. Informational searches trigger AI Overviews 99% of the time.
3. AI Overviews reduce organic click-through rates by up to 58%.
4. 92-94% of AI Mode searches end without external clicks.
5. ChatGPT now processes roughly 2.5 billion prompts every day.
6. AI-referred retail traffic surged 693% year-over-year during the holidays.
AI Overviews Statistics
AI Overviews are rapidly expanding across global search, changing how users access information and making it important to adapt content strategies to maintain visibility.
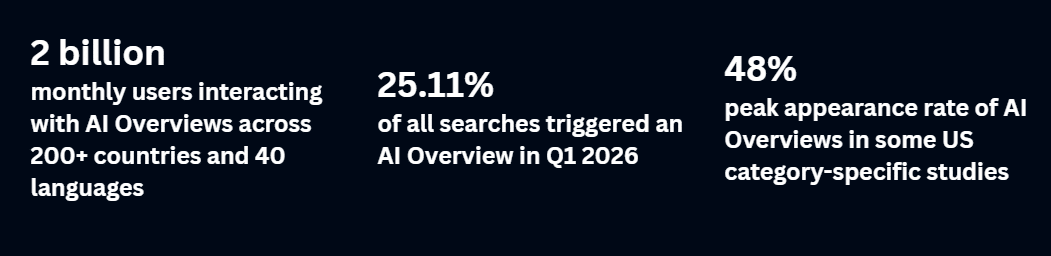
7. Alphabet reported that 2 billion monthly users now interact with AI Overviews across 200+ countries and 40 languages, giving the feature one of the widest global rollouts in search history.
AI Overview visibility varies significantly depending on the query set being analyzed. Broad studies that examine all search types tend to report lower visibility rates, while studies focused on informational or question-based searches show much higher adoption.
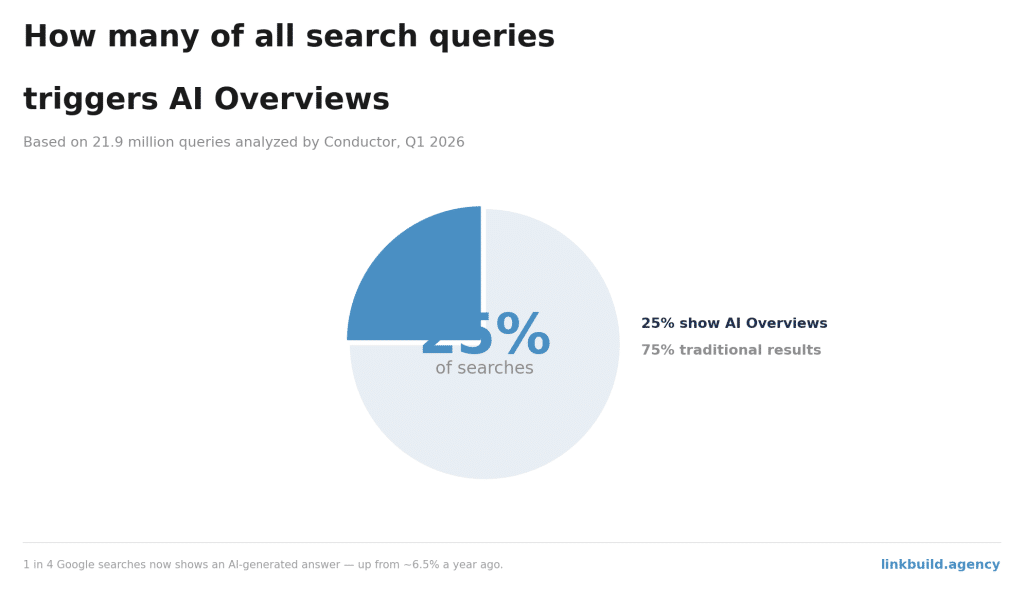
8. Conductor found that AI Overviews appeared in 25.11% of all analyzed searches in Q1 2026, based on 21.9 million queries. This figure is one of the broadest estimates because it includes multiple search intents rather than focusing solely on informational searches.
9. Some category-specific US studies reported visibility rates as high as 48%, according to BrightEdge. These higher figures reflect query sets that are more likely to trigger AI-generated answers rather than the overall search landscape.
AI Overview visibility varies significantly depending on the query set being analyzed. Broad studies that examine all search types tend to report lower visibility rates, while studies focused on informational or question-based searches show much higher adoption.
10. Ahrefs’ analysis of 146 million SERPs showed that 57.9% of question-based queries display an AI Overview.
11. AI Overviews now dominate informational search results, appearing in 99.9% of purely informational keywords, with 46% tied to long-tail searches containing 7+ words.
12. AI Overviews appear in only 7.9% of local searches, showing Google still treats location-based intent differently from informational queries.
13. According to Digital Bloom, AI Overview coverage grew from ~6.49% to ~48% in roughly a year, suggesting a possible rise to 70-80% of eligible queries by the end of 2026.
Taken together, the studies suggest that roughly one-quarter of all searches currently display AI Overviews, while informational and question-driven searches experience far higher coverage rates.
Sectors Most Impacted By AI Overviews
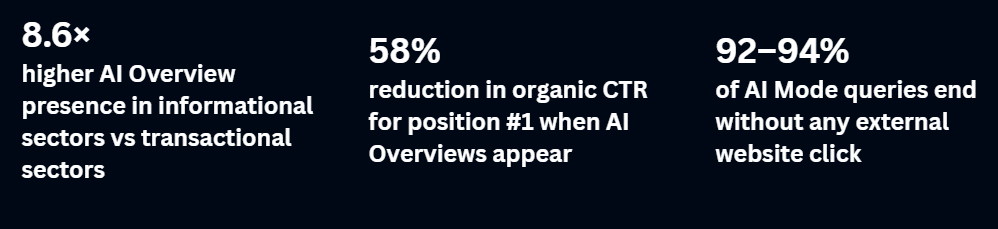
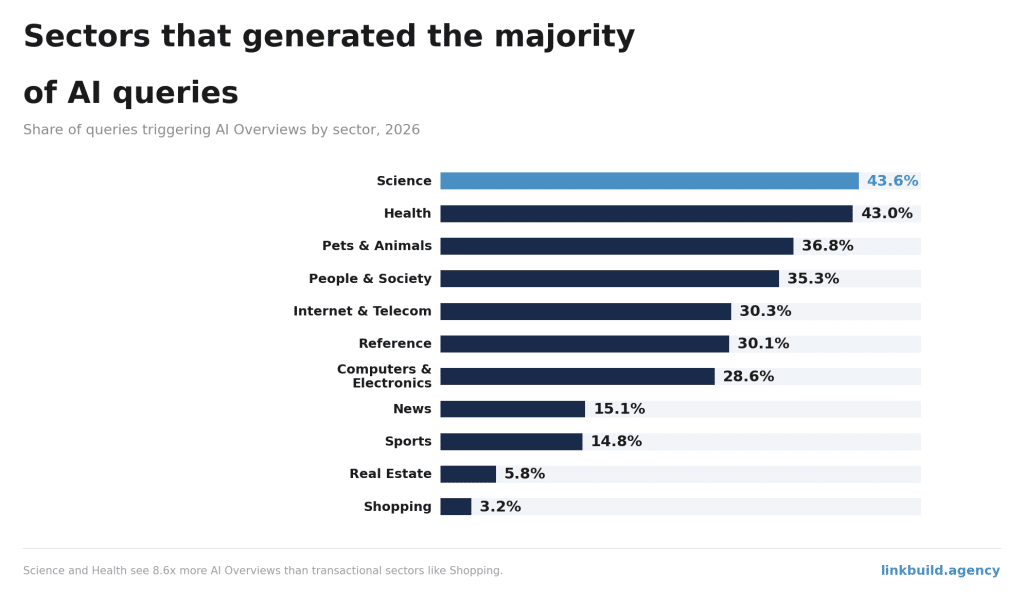
AI Overviews appear about 8.6× more often in informational sectors like Science and Health than in transactional sectors like Shopping and Real Estate. This shows Google prioritizes knowledge-based queries over purchase-intent searches.
14. According to Ahrefs data, expertise-driven sectors have 3.7× higher AI Overview presence than dynamic sectors such as News and Sports, suggesting that AI performs best when information is stable, authoritative, and less time-sensitive.
The table below shows which sectors generated the majority of AI queries:
| Sector | AI Queries % |
|---|---|
| Science | 43.60% |
| Health | 43.00% |
| Pets & Animals | 36.80% |
| People & Society | 35.30% |
| Internet & Telecom | 30.30% |
| Reference | 30.10% |
| Computers & Electronics | 28.60% |
| Shopping | 3.20% |
| Real Estate | 5.80% |
| Sports | 14.80% |
| News | 15.10% |
Source: Ahrefs
The sector breakdown reveals that AI Overviews are not expanding evenly across search. Industries built around factual, evergreen information, such as health, science, and education, are seeing far greater AI visibility than sectors where information changes rapidly, or transactions occur directly on search results.
Businesses in knowledge-driven industries face the highest risk of traffic displacement and may need to prioritize AI citation visibility alongside conventional SEO.
15. Organic CTR plummeted 25% (from 3.2% to 2.4%) for queries with AI Overviews. Paid CTR climbed up 11% (from 14.6% to 16.2%) on the same AI Overview queries, as reported by Seer Interactive.
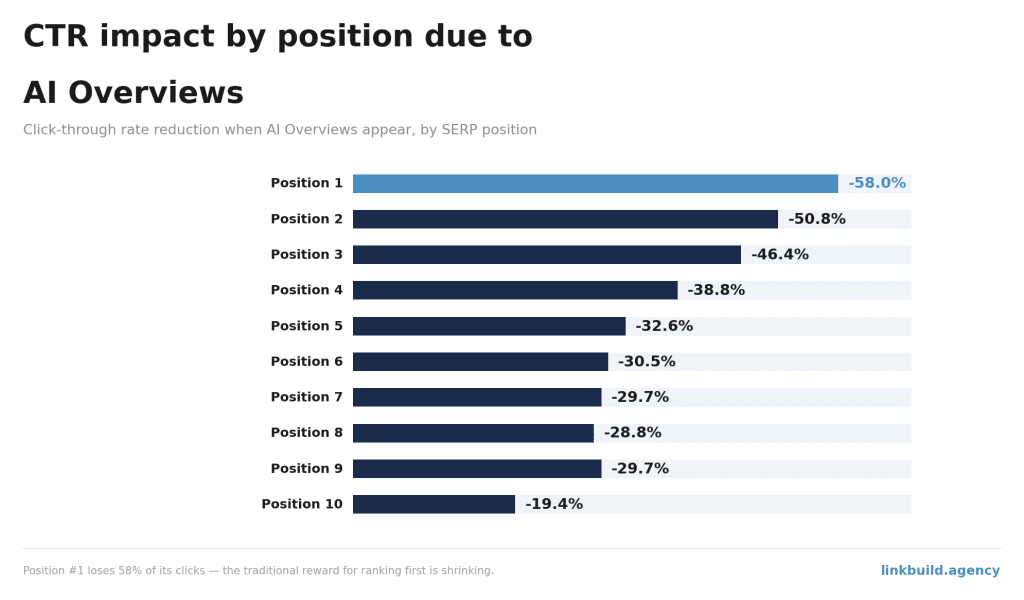
16. AI Overviews reduce organic CTR for position #1 by up to 58%, according to Ahrefs. The traditional reward for ranking first is shrinking.
17. Position #2 can lose as much as 50.8% of its clicks, while lower rankings see progressively smaller declines. AI Overviews appear to absorb traffic that once flowed to the top of the organic results page.
Have a look at the CTR impact by position due to AI overviews:
| Position in search results | Clickthrough rate impact |
|---|---|
| 1 | -58.00% |
| 2 | -50.80% |
| 3 | -46.40% |
| 4 | -38.80% |
| 5 | -32.60% |
| 6 | -30.50% |
| 7 | -29.70% |
| 8 | -28.80% |
| 9 | -29.70% |
| 10 | -19.40% |
18. Individual websites experience an average 34.5% CTR reduction when AI Overviews appear for their keywords, as given by another Ahrefs study.
19. 92-94% of AI Mode queries end without a single click to an external website.
Source: Semrush
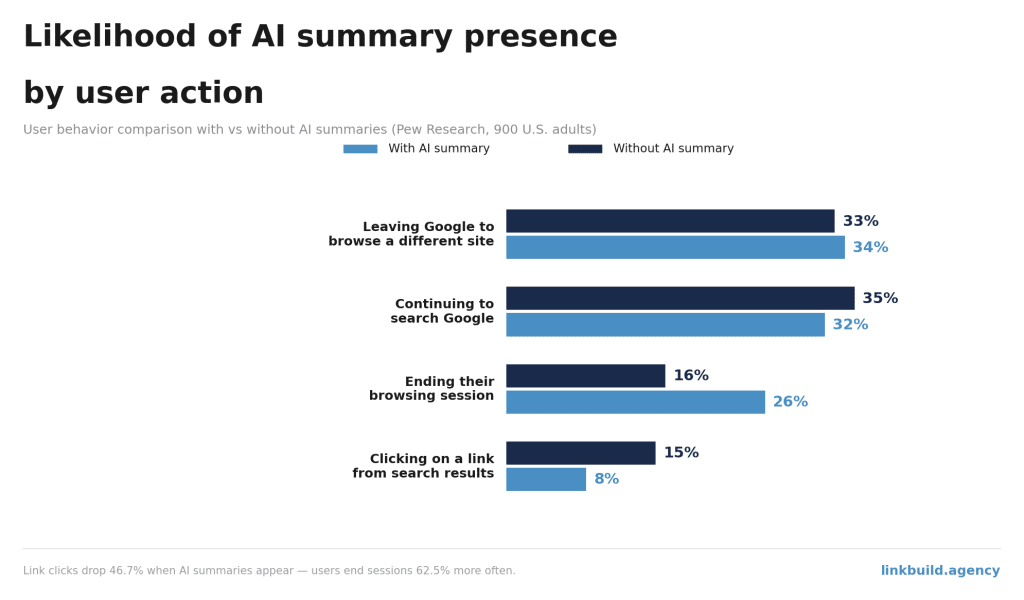
20. A Pew Research study involving 900 U.S. adults saw that users who saw an AI summary clicked a traditional organic result in 8% of visits, versus 15% for users who saw no AI summary. This led to click-through falling 46.7% when AI summaries appeared.
Below are the various user actions and the likelihood of pages with an AI summary against those with no AI summary:
| User action after Google search | Pages with AI summary | Pages without an AI summary |
|---|---|---|
| Clicking on a link from the search results | 8% | 15% |
| Ending their browsing session | 26% | 16% |
| Continuing to search Google | 32% | 35% |
| Leaving Google to browse a different site | 34% | 33% |
21. Brands cited in AI Overviews earned approximately 120% more organic clicks per impression and 41% more paid clicks per impression than brands not cited on the same AIO SERPs, according to Seer Interactive.
22. According to Ahrefs, 76.1% of URLs cited in AI Overviews also rank in Google’s top 10.
23. However, 40% of AI Overview citations come from pages ranking below position 10, according to SEOmator.
24. Ahrefs found that AI Overviews and AI Mode cite different sources; only 13.7% overlap between the two.
25. Branded web mentions have the strongest correlation (0.664) with AI Overview appearances, far higher than backlinks (0.218), according to Ahrefs.
26. Sites with over 32,000 referring domains are 3.5x more likely to be cited by ChatGPT, per GoodFirms.
AI Search Statistics
AI search adoption is accelerating rapidly, with platforms such as ChatGPT and Perplexity attracting hundreds of millions of users and generating billions of interactions each month.

Platform Scale & Growth
27. OpenAI reported that ChatGPT reached 900 million weekly active users as of February-April 2026, up from 400 million in February 2025.
28. AI search platforms continue to scale at an extraordinary pace. According to TechCrunch, ChatGPT now processes roughly 2.5 billion prompts daily, while Semrush reports that it receives about 5.2 billion monthly visits, making it one of the world’s most visited websites.
29. Meanwhile, Business of Apps reports that Perplexity reached 45 million active users in the second half of 2025, highlighting growing competition in the AI search market.
30. Traffic from Large Language Models (LLMs) rose from about 17,000 to 107,000 sessions, comparing January-May 2024 to the same period in 2025, per Semrush.
User Behavior & Search Intent
44% of AI-powered search users say it’s their primary source of insight, ahead of traditional search at 31%.
31. According to McKinsey, 50% of consumers now intentionally seek out AI-powered search tools.
32. 80% of consumers now rely on AI-powered summaries to get their answer in at least 40% of their searches, without clicking to any destination site, according to Bain & Company.
33. LinkedIn reports that 93.7% of ChatGPT searches are informational, leaving 6.3% share for other intents.
34. Position Digital states that around 3 in 4 American respondents say they search with AI weekly, with top use cases including quick facts, shopping research, and health information.
35. Marketing Dive reports that 31% of Gen Z respondents say they begin searches using AI platforms or chatbots, compared with ~20% of the general population.
36. According to Pew Research, 58% of US adults under 30 have used ChatGPT, nearly double the rate of adults 30 and older.
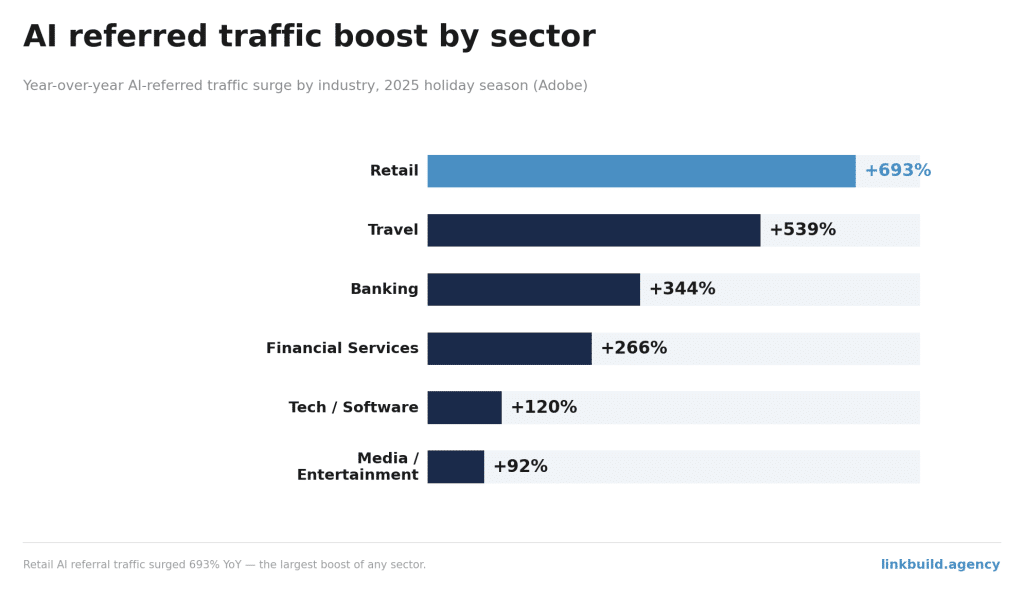
37. Adobe stated that AI-referred traffic to US retail sites surged 693% year-over-year during the 2025 holiday season.
The table below shows which sectors’ sites gained an AI-referred traffic boost:
| Sector | Traffic Surge |
|---|---|
| Retail | +693% YoY |
| Travel | +539%YoY |
| Financial services | +266% YoY |
| Banking | +344% YoY |
| Media/Entertainment | +92% YoY |
| Tech/Software | +120% YoY |
38. Content structure matters greatly, as stated by Averi, that LLMs are 28-40% more likely to cite content with structured data and clear definitions.
39. Super Prompt found that AI search traffic converts at 14.2%, compared to 2.8% for Google search traffic.
AI SEO Statistics By Country
AI Overview visibility varies significantly across countries and languages, making localization and market-specific search behavior critical for understanding global AI search adoption.
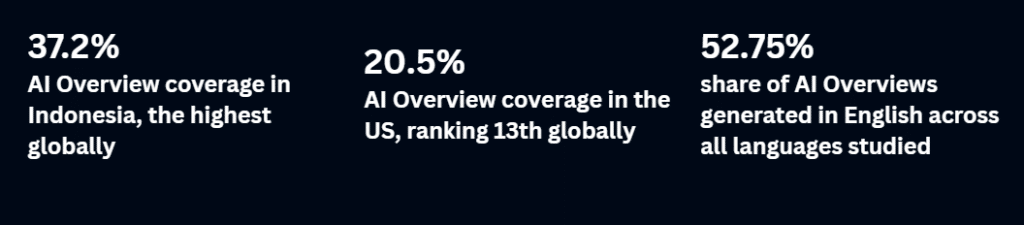
Ahrefs found significant differences in AI Overview visibility across countries, with several Southeast Asian markets leading adoption.
The US sits 13th with coverage at 20.5%.
40. Indonesia turned more than 1 in every 3 tracked searches into generated summaries, the highest share among all countries listed.
41. India recorded the biggest footprint overall, with 8 million generated AI summaries spread across 30 million tracked keywords, the biggest in absolute terms.
42. Japan matched Brazil with a 25% coverage rate, despite tracking 3 million fewer keywords.
43. Nigeria crossed a 26% coverage rate with just 1.6 million tracked keywords, outperforming several larger search markets.
AI Overview visibility varies widely by country, with several Southeast Asian markets showing significantly higher adoption rates than larger search markets such as the United States.
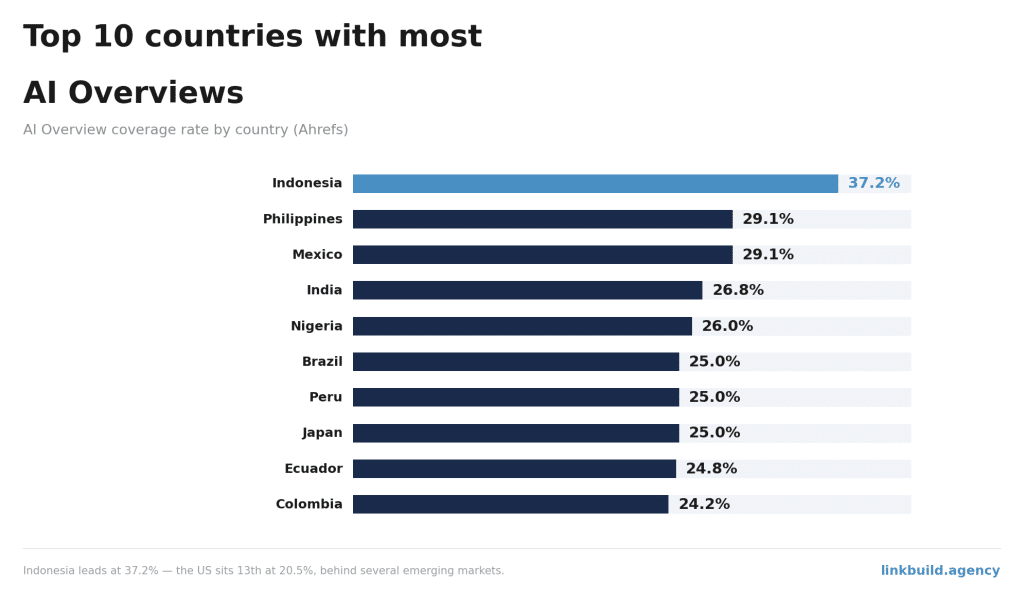
| Rank | Country | Keywords | AI Overviews | AI Overviews Coverage % |
|---|---|---|---|---|
| 1 | Indonesia | 11 million | 4.1 million | 37.20% |
| 2 | Philippines | 6.4 million | 1.9 million | 29.10% |
| 3 | Mexico | 12 million | 3.5 million | 29.10% |
| 4 | India | 30 million | 8.0 million | 26.80% |
| 5 | Nigeria | 1.6 million | 423.0 k | 26% |
| 6 | Brazil | 21 million | 5.3 million | 25% |
| 7 | Peru | 2.8 million | 696.0 k | 25% |
| 8 | Japan | 18 million | 4.5 million | 25% |
| 9 | Ecuador | 1.3 million | 322.0 k | 24.77% |
| 10 | Colombia | 6.5 million | 1.6 million | 24.20% |
The country-level differences suggest that AI search adoption is influenced by more than market size alone.
Several emerging markets show higher AI Overview penetration than larger, mature search markets, indicating that Google’s rollout and user behavior vary significantly by region.
This makes country-specific SEO monitoring increasingly important, as AI visibility trends in one market may not reflect what happens elsewhere.
AI Overviews Share By Languages
English dominates AI Overview generation, accounting for more than half of the 108 million AI Overviews analyzed by Ahrefs.
44. Spanish ranks second with 12.5 million generated summaries, but still trails English by nearly 45 million.
45. Portuguese, Japanese, and German combined account for less than 13% of all generated summaries globally.
The top 10 languages in AI overviews are as follows:
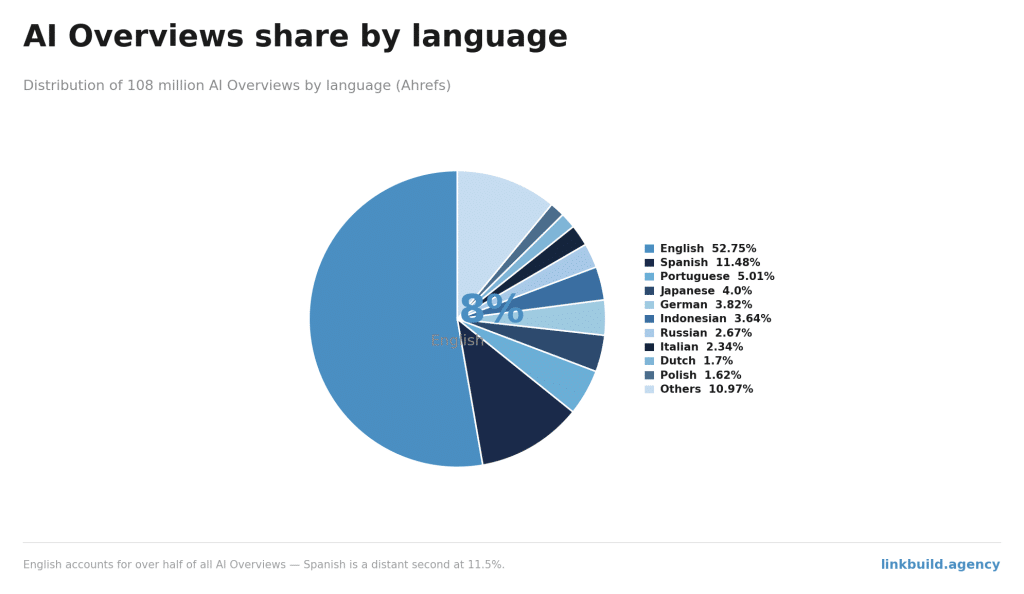
| Rank | Language | AIOs by language | Percentage |
|---|---|---|---|
| 1 | English (all) | 57.2 million | 52.75% |
| 2 | Spanish (all) | 12.5 million | 11.48% |
| 3 | Portuguese (all) | 5.4 million | 5.01% |
| 4 | Japanese | 4.7 million | 4% |
| 5 | German (all) | 4.1 million | 3.82% |
| 6 | Indonesian | 3.9 million | 3.64% |
| 7 | Russian | 2.9 million | 2.67% |
| 8 | Italian | 2.5 million | 2.34% |
| 9 | Dutch | 1.8 million | 1.70% |
| 10 | Polish | 1.8 million | 1.62% |
Source: Ahrefs
Ads In AI Mode
Google is aggressively monetizing AI search surfaces, and the pace of that monetization is accelerating.
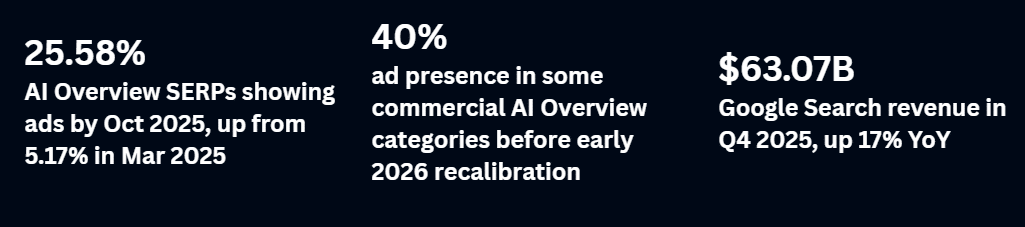
Ad Presence in AI Results
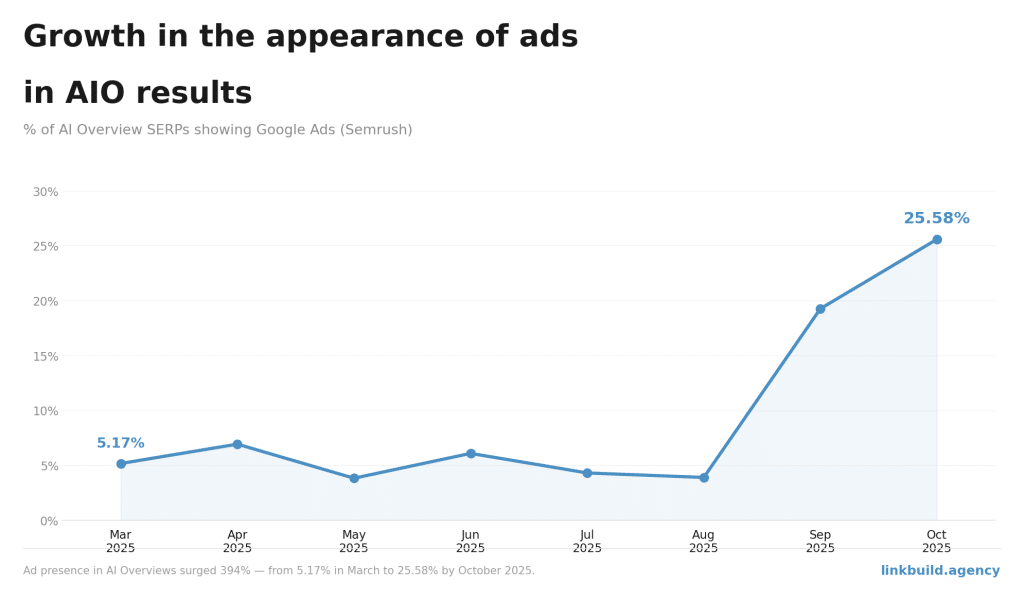
46. Ads now appear alongside 25.58% of AI Overview results, up from just 5.17% in early 2025, a 394% increase.
Here is the growth in the appearance of ads in AIO results:
| Month | % of AI Overview SERPs with Google Ads |
|---|---|
| 03/2025 | 5.17% |
| 04/2025 | 6.93% |
| 05/2025 | 3.83% |
| 06/2025 | 6.09% |
| 07/2025 | 4.31% |
| 08/2025 | 3.90% |
| 09/2025 | 19.26% |
| 10/2025 | 25.58% |
Source: Semrush
47. Digital Applied’s tracking suggests that ad presence approached 40% for some commercial query categories in late 2025, then declined in early 2026.
48. Google VP of Ads Dan Taylor told Business Line and confirmed that ads within AI Overviews monetize at the same rate as traditional search ads.
49. Digital Applied identified 816 experiment IDs related to AI Mode advertising tests, suggesting Google is actively evaluating monetization formats.
Google Search Revenue Growth
Despite concerns that AI-generated answers could reduce ad clicks, Google’s search business continues to grow. Alphabet reported that Google Search revenue reached $63.07 billion in Q4 2025, up 17% year over year, while search queries reached an all-time high during the AI Overview rollout period.
The data suggests that AI search features have not yet disrupted Google’s ability to monetize search traffic.
50. Yahoo Finance reported that Q1 2026 Search revenue reached $60 billion, marking a 19% year-over-year increase. The company also stated that search queries hit an all-time high, with AI Overviews and AI Mode contributing to higher usage.
51. Search Engine Journal noted that revenue growth accelerated throughout 2025: 10% in Q1 → 12% Q2 → 15% Q3 → 17% Q4.
52. According to the Google Blog, Alphabet generated $402.8 billion in revenue in 2025, becoming the first year in the company’s history to surpass the $400 billion mark.
AI Bot, & Crawler Statistics
Data from Cloudflare, HUMAN Security, and Search Engine Journal shows that AI crawlers are accounting for a growing share of bot traffic, prompting websites to reassess bot access policies, SEO visibility, and server infrastructure.
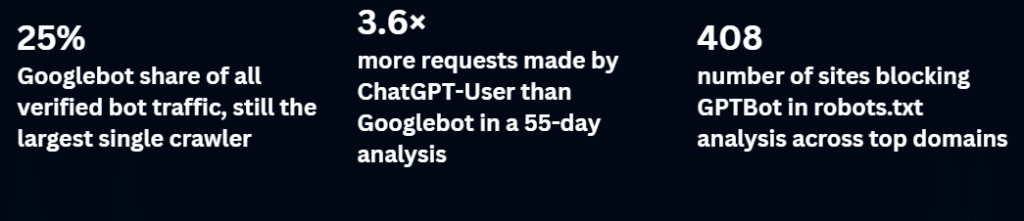
53. Cloudflare data shows that Googlebot remains the largest traffic source, accounting for more than 25% of all verified bot traffic and 4.5% of all HTML request traffic, more than all other AI bots combined.
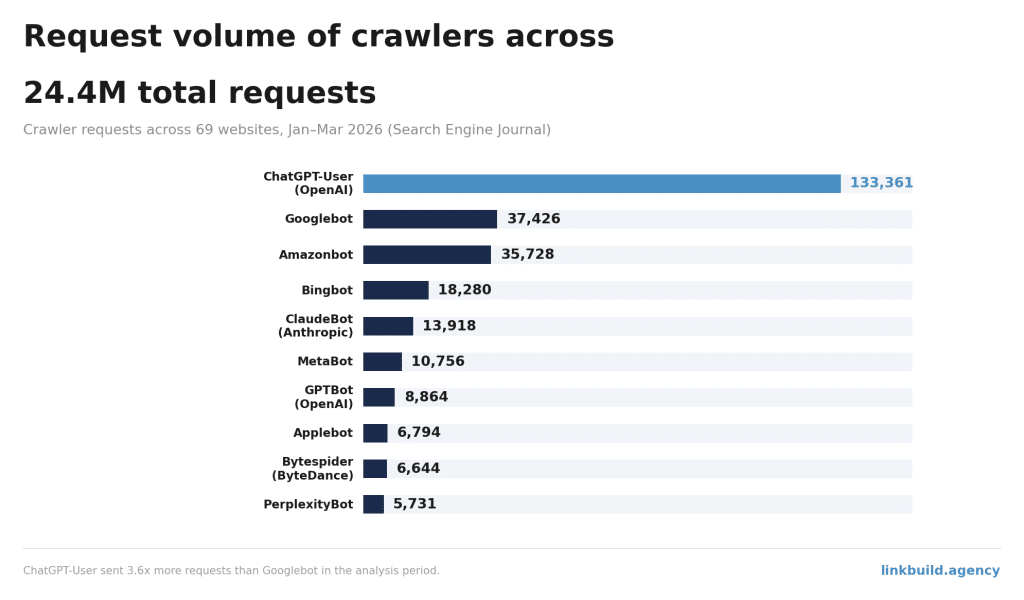
54. OpenAI’s ChatGPT-User crawler made 3.6x more requests than Googlebot in a 55-day analysis (Jan-March 2026), across 69 websites and 24.4 million requests, according to Search Engine Journal.
The table below shows which crawler sent how many requests in the analysis period:
| Rank | Crawler | Requests |
|---|---|---|
| 1 | ChatGPT-User (OpenAI) | 133,361 |
| 2 | Googlebot | 37,426 |
| 3 | Amazonbot | 35,728 |
| 4 | Bingbot | 18,280 |
| 5 | ClaudeBot (Anthropic) | 13,918 |
| 6 | MetaBot | 10,756 |
| 7 | GPTBot (OpenAI) | 8,864 |
| 8 | Applebot | 6,794 |
| 9 | Bytespider (ByteDance) | 6,644 |
| 10 | PerplexityBot | 5,731 |
55. Hostinger reports that OpenAI’s OAI-SearchBot has achieved an average web coverage of 55.67% across monitored websites.
56. Training crawlers account for 67.5% of AI-driven traffic, although their share is declining as agentic and scraping bots continue to grow, according to HUMAN Security.
Website Blocking & robots.txt Statistics
AI crawlers are the most frequently fully disallowed user agents in robots.txt files.
Cloudflare Radar’s 2025 analysis found 3,879 robots.txt files across the top 10,000 domains.
57. Among those, GPTBot appeared in the highest combined count, reaching 408 blocked cases across the sampled sites.
58. Googlebot shows a rare pattern: partial blocks (244) are more than 10× its full blocks (22).
The table below shows which AI bots are fully and partially blocked among the 3,879 robots.txt files:
| Crawler | Fully Disallowed | Partially Disallowed | Total |
|---|---|---|---|
| GPTBot | 319 | 89 | 408 |
| CCBot | 301 | 57 | 358 |
| Googlebot | 22 | 244 | 266 |
| Google-Extended | 234 | 58 | 292 |
| ClaudeBot | 259 | 63 | 322 |
| Bytespider | 244 | 35 | 279 |
| anthropic-ai | 138 | 41 | 179 |
| PerplexityBot | 147 | 54 | 201 |
| ChatGPT-User | 142 | 46 | 188 |
| Applebot-Extended | 181 | 34 | 215 |
| Claude-Web | 110 | 22 | 132 |
| meta-externalagent | 196 | 40 | 236 |
| Amazonbot | 172 | 46 | 218 |
| bingbot | 24 | 119 | 143 |
| OAI-SearchBot | 91 | 46 | 137 |
| meta-externalfetcher | 80 | 1 | 81 |
| Perplexity-User | 64 | 1 | 65 |
| Claude-User | 68 | 0 | 68 |
| facebookexternalhit | 1 | 33 | 34 |
| Claude-SearchBot | 62 | 0 | 62 |
Source: Cloudflare
59. AI crawler fetcher bots can exceed 39,000 requests per minute, putting pressure on unprotected infrastructure and mimicking the effects of DDoS attacks, per Concord Monitor.
AI SEO Market Size
Business Research predicts that the AI SEO tools market is projected to grow from $2.43 billion in 2026 to nearly $5.97 billion by 2035 with a 10.5% CAGR.
It shows that SEO software is shifting from an optional toolset to a long-term operating expense for businesses managing online acquisition.
Below is the estimated growth of the AI SEO tools market:
| Year | Market Size |
|---|---|
| 2026 | $2.43 billion |
| 2027 | $2.69 billion* |
| 2028 | $2.97 billion* |
| 2029 | $3.28 billion* |
| 2030 | $3.63 billion* |
| 2031 | $4.01 billion* |
| 2032 | $4.43 billion* |
| 2033 | $4.90 billion* |
| 2034 | $5.41 billion* |
| 2035 | $5.97 billion |
*Estimated Figures
60. Business Research also reports that nearly 70% of AI SEO tool deployments are cloud-based, making cloud delivery the dominant deployment model in the industry.
| Deployment Split | Market Share |
|---|---|
| Cloud-based | 70% |
| On-premise | 30% |
Source: Business Research
61. Generative Engine Optimization (GEO), which also works in parallel with the AI SEO market, is expected to grow at a surprising 40.6% CAGR and grow from $1.08 billion in 2026 to $16.62 billion by 2034, as predicted by Dimension Market Research.
Forecasts suggest GEO could become one of the fastest-growing segments within search marketing over the next decade.
| Year | Market Size |
|---|---|
| 2026 | $1.08 billion* |
| 2027 | $1.53 billion* |
| 2028 | $2.15 billion* |
| 2029 | $3.02 billion* |
| 2030 | $4.25 billion* |
| 2031 | $5.98 billion* |
| 2032 | $8.40 billion* |
| 2033 | $11.82 billion* |
| 2034 | $16.62 billion* |
*Estimated Figures
Source: DMR
AI Search And Discoverability Statistics
Search is shifting toward zero-click results, where AI summaries and overviews reduce organic traffic but increase visibility risk for informational industries.
62. Semrush found that 58.5% of US Google searches and 59.7% of EU Google searches ended with zero clicks in 2024.
63. Another Semrush study found that 92-94% of Google AI Mode sessions were zero-click, meaning users received answers directly within Google’s AI interface without visiting external websites.
64. Bain reports that 60% of searches in traditional search engines already end without a click due to AI summaries.
65. Digital Applied shows that informational queries saw 30-40% organic traffic declines as AI Overviews handle these query types most aggressively.
66. B2B technology businesses face AI Overview exposure rates of around 70% for their typical query types.
These are the industries that face the most AI overview exposure:
| Industry | AIO Exposure | Traffic Impact | Risk Level |
|---|---|---|---|
| B2B Technology | ~70% | -35 to -45% | Critical |
| Healthcare | ~60% | -30 to -40% | Critical |
| Education | ~55% | -25 to -35% | High |
| Finance | ~45% | -20 to -30% | High |
| SaaS / Digital Services | ~40% | -15 to -25% | Moderate |
| Local Services | ~15% | -5 to -10% | Low |
| E-commerce | ~4% | -2 to -5% | Low |
The sector breakdown reveals that AI Overviews are not expanding evenly across search. Industries built around factual, evergreen information, such as health, science, and education, are seeing far greater AI visibility than sectors where information changes rapidly, or transactions occur directly on search results.
Businesses in knowledge-driven industries face the highest risk of traffic displacement and may need to prioritize AI citation visibility alongside conventional SEO.
Source: Digital Applied
67. A Nielsen Norman Group survey found people use AI to explore and synthesize information, but still rely on traditional search to fact-check accuracy.
68. Demand Local says that most agency portfolios are seeing 30-70% declines on informational-heavy clients between late 2024 and early 2026.
69. HubSpot lost 70-80% of organic traffic; Business Insider lost 55%.
Traditional Vs AI SEO
As search behavior shifts from blue links to AI-generated responses, the metrics that define visibility, clicks, and conversions are changing just as quickly.
The comparison below highlights how traditional SEO priorities differ from AI SEO across traffic patterns, ranking signals, and performance measurement.
| Metric | Traditional SEO | AI SEO / GEO |
|---|---|---|
| Primary goal | Rank high in blue-link results | Appear in AI-generated answers |
| CTR for #1 position | ~27.6% | ~0.61-2.4% when AI Overview is present |
| Zero-click rate | ~60% | 83-93% |
| Key ranking signal | Backlinks (correlation 0.218 with AI visibility) | Branded mentions (correlation 0.664) |
| Content format | Keyword density, metadata | Definitions, Q&A structure, plain language |
| Conversion rate | 2.8% | 14.2% |
| Measurement | Sessions, rankings, CTR | Citation share, AI visibility %, assisted pipeline |
| Organic traffic trend | Down 2.5% overall (Feb 2024-Nov 2025) | AI referral traffic up 693% in retail |
| ROI measurement | Sessions, rankings, and CTR tracked through GA4 and Search Console | Citation share, AI visibility %, and referral traffic emerging as key metrics |
| Ranking #1 relevance | 86.5% say it still matters | 76.1% of AI Overview citations come from Google’s top 10 results |
Source: Backlinko, Seer Interactive, Bain, Digital Applied, Superprompt, Graphite, Adobe, SEO Sandwitch, SeoProfy, GoodFirms, Ahrefs, Ahrefs 2
Future of AI SEO
AI is reshaping search by reducing organic traffic and shifting attention toward AI-driven answer engines, forcing businesses to adapt SEO and marketing strategies.

Gartner predicted traditional search engine volume would drop 25% by 2026 due to AI chatbots and virtual agents. 2025 data suggests the trajectory is on course.
70. By 2028, Gartner predicts organic search traffic to websites will decrease by 50% or more as generative AI search scales.
71. By 2028, McKinsey projects that $750 billion in US revenue will flow through AI-powered search.
Source: McKinsey
72. 68% of marketing organizations are actively adapting strategies in response to AI search; 57% describe their outlook as “cautiously optimistic,” as per BrightEdge.
73. EMarketer projects that US AI ad spending is expected to reach $32 billion in 2026 and exceed $68 billion by 2030.
SEO.com projects that multilingual AI content generation and AI-powered customer service chatbots will become widely adopted SEO tools by 2027.
Also Check:
Methodology
This report compiles AI SEO and AI search statistics from publicly available studies, platform disclosures, industry research reports, and search marketing datasets published between 2024 and 2026. Sources include organizations such as Ahrefs, Semrush, Conductor, BrightEdge, Adobe, Pew Research, McKinsey, Alphabet, Cloudflare, and other reputable research providers referenced throughout the article.
Where available, we prioritized large-scale datasets involving millions of search queries, SERPs, website visits, crawler requests, or user interactions. Because methodologies differ across studies, figures may vary depending on the search intent analyzed, geographic coverage, language set, timeframe, and definition of AI search features.
Statistics are presented as reported by their original sources and are intended to provide directional insight into the growth of AI Overviews, AI search adoption, user behavior, traffic trends, and the evolving SEO front.